Ed : Westconnex is transport project that is supposed to solve traffic congestion. So while the analysis of impacts on our community is important so too is the credibility of the Traffic and Transport analysis. The full details or those that are published can be found in Appendix G.In this last part of his submission, transport planner and modelling specialist Chris Standen spells out a myriad of reasons why he argues that the Traffic and Transport analysis is not reliable. While unlike Standen, the editors of the People’s M5 EIS are not experts in traffic modelling, the levels of unknowns, complexity and uncertainty are obvious to any reader. This is of great public concern when you think that billions of Federal and state money have been committed before the EIS was even lodged. We certainly need these gaps to be filled and answers to all these questions.
Read Parts one, two and three of Chris Standen’s submission
General Comments
The Traffic and Transport Assessment does not stand up to scrutiny. There is not enough information about the methodology, input data or assumptions for the forecasts to be independently verified.
The study area ( area that is analysed) is too small to capture adequately the traffic and transport impacts of the project. The project will affect home location choice, work location choice, trip generation, destination choice, mode choice and route choice across the whole metropolitan area. For example, people travelling between Penrith and the Airport will have a number of options (train; drive via M7/M2; drive via M4; drive via M7/M5; drive via un-tolled roads).
The resulting changes in travel behaviour will have implications for local and regional traffic and transport throughout the Sydney metropolitan area. For example, more Penrith residents may be encouraged to drive to the city rather than use the train, which will (a) increase traffic volumes and associated impacts on local/regional roads in/around Penrith and (b) reduce rail patronage, which could in turn lead to reduced service frequencies affecting remaining rail users.
The Traffic and Transport Assessment does not assess or even acknowledge these traffic and transport impacts beyond the study area.
There is no sensitivity analysis in the Traffic and Transport Assessment. The effects of varying key assumptions (e.g., willingness to pay the tolls) have not been described.
The travel time calculations do not appear to include delays at on-ramps and off-ramps. Although it is not even mentioned in the Traffic and Transport Assessment, the Business Case states that ramp metering ( signals to regulate flow onto the ramps) will be used. This will cause delays for travellers entering/exiting the M5; these delays have not been included in the Traffic and Transport Assessment.
Travel time and accessibility impacts for non-motorised modes (walk and bicycle) have not been modelled or objectively assessed.
Impacts of disruptive technologies on future driving demand have not been not considered (e.g., automated vehicles).
Inter-generational changes in vehicle ownership, driver licensing and transport preferences have not been considered.
Changes in aggregate measures have not been provided for the whole study area, nor for the wider metropolitan area, e.g.,:
- Overall increase in VKT.
- Change in average trip distance.
- Change in average trip duration.
- Change in total travel time.
Comments on specific sections
( The references here are to sections in Appendix G)
a) Appendix G, Section 3 Strategic Context 4.2.1
The stated justification for the project is based on the discredited ‘predict and provide’ approach to transport planning, whereby it is assumed that transport demand will continue to grow, and that capacity must be increased to accommodate it. In practice, transport demand in cities is limited by capacity: as capacity increases, so does demand (induced demand). It is geometrically impossible to provide enough roadway capacity to accommodate all the latent demand for driving (i.e., where everyone can live and work where they want, and make all the driving trips they want, when they want, to wherever they want in free-flow traffic) in a city of Sydney’s population.
Furthermore, the most efficient way to accommodate the transport and accessibility needs of a growing population is through mass transit and better land use-transport integration. Urban motorways are a very inefficient way of moving people around. A single traffic lane can transport a maximum of only 2000 people per hour (in ideal conditions); asingle railway line can transport 20,000 people per hour.
The statement “It is acknowledged that any investment in motorway infrastructure has to be aligned with supporting public and active transport initiatives to achieve an increase in capacity, while aiming to reduce the reliance and demand of private vehicles on the future road network” is contradictory: increasing motorway capacity will only serve to increase private vehicle demand.
b) Appendix G, Assessment methodology, 4.2.2
- There is not enough information about the modelling methodology for it to be replicated and the outputs independently verified.
- The transport model (WRTM) has not been made available for independent verification.
- The model input data and assumptions have not been made available for independent verification. What toll prices have been assumed?
- The study area is too small to capture all the transport impacts of the project. The project will affect transport demand and behaviour across the whole metropolitan area.
- Insufficient detail on the Value of Travel Time Saving (VTTS)/Willingness to Pay (WTP) model:
- What are the form and parameters of the model?
- If it was based on stated preference surveys, then how has the issue of hypothetical bias been addressed?
- Has the model been validated? Previous toll choice models in Australia have overestimated WTP for toll roads.
- Does the model include the negative utility of the tunnel environment (monotony, no natural light, poor air quality)?
- What value of WTP has been used in the WRTM?
- What is the confidence interval around the WTP value used?
- Does the WTP estimate take into account tolls that motorists currently pay (toll saturation)? E.g., a road user may be willing to pay an additional $10/day if he/she currently pays nothing, but not willing to pay an additional $10 if he/she is already spending $15 on tolls.
- Why has the weekend period not been modelled, when current weekend traffic volumes are higher than weekday traffic volumes in some places?
- Insufficient information about the travel zone structure in the Westconnex Road Traffic Model ( WRTM)
- What are the travel zones based on? How big are they?
- How are intra-zonal trips modelled?
- How are trips to/from external zones modelled?
- Induced demand has not been adequately addressed.
- The model ignores the impact of the project on the long-term transport decisions of individuals and firms, including:
- Residential location choice – the project will encourage more people to move further from work (sprawl), thereby increasing average travel distances/demand.
- Work location choice – the project will encourage more people to work further from home, thereby increasing average travel distances/demand.
- Car ownership choice – the project will encourage more car ownership and use.
- Firm location choice – the project will encourage firms to locate in locations further away from their labour supply/customers/suppliers than they otherwise would, thereby increasing travel distances/demand.
- To my knowledge, there has been no long-term evaluation/verification of the methodology used to forecast induced demand (New Zealand Transport Agency Economic Evaluation Manual (EEM)). Induced demand by its nature materialises over several years, as people gradually move home/work location etc. Without a long-term evaluation/verification of the methodology, there can be no confidence in the induced demand forecast produced.
- The model ignores the impact of the project on the long-term transport decisions of individuals and firms, including:
- Insufficient detail on origin-destination demand matrix generation:
- What are the form and parameters of the generalised cost function?
- How were shortest paths calculated?ion:
- Insufficient detail on trip generation:
- What are the form and parameters of the trip production function, and how was it estimated?
- What are the form and parameters of the trip attraction function, and how was it estimated?
- How were trip productions and trip attractions balanced?
- Insufficient detail on trip distribution/modal split:
- What are the form and parameters of the gravity model used?
- What are the form and parameters of the deterrence function used?
- How has modal split been estimated?
- Insufficient detail on road traffic assignment:
- Is assignment stochastic or deterministic?
- What link loading/flow function was used? What parameters were chosen?
- Were intersection delays included?
- Insufficient detail on public transport assignment:
- How were access and egress points determined?
- How were route strategies determined?
- Non-motorised trips ( pedestrians, cyclists) were not included in the WRTM or LinSig modelling. (LinSig is a traffic modelling package for the assessment and design of traffic signal intersections, either individually or as a network that comprises of a number of intersections.)
- Impacts on accessibility have not been modelled/assessed.
- Most transport is not an end in itself – it is a means to access work, education, services etc. How does the project affect accessibility?
- Equity and equality impacts not described.
- How many people have better accessibility with the project?
- How many people have poorer accessibility with the project?
- Do benefits/impacts accrue to any population groups more than others, e.g., people with a disability or on low incomes?
- Downs-Thomson Paradox is not considered (Ed: According to the Downs-Thomson paradox, improved road capacity increases travel times because it attracts more users to the road and away from public transport.)
- The project will attract passengers away from public transport to driving. As such, public transport patronage will be lower than it would be without the project. This could result in public transport service levels being cut, which will encourage further mode shift from public transport to road.
- No sensitivity analysis. ( Ed: The parameter values and assumptions of any model are subject to change and error. Sensitivity analysis , broadly defined, is the investigation of these potential changes and errors and their impacts on conclusions to be drawn from the model.)
- Given the numerous assumptions and approximations in the model, there needs to be some sensitivity analysis, e.g. How will traffic volumes be affected if (when) the WTP for the toll turns out to be lower than the point estimate used?
c) Section 7 Assessment of construction impacts 4.2.3
- Impacts on travel times for all modes (driving, public transport, walk and bicycle) have not been assessed/reported. The construction activities (Ed: in some cases over three years) will delay travellers in a number of ways:
- Additional construction/workforce traffic.
- Temporary road and lane closures.
- Speed limit reductions.
- The increased parking occupancy rates will mean additional time looking for parking.
- Cumulative construction impacts for the New M5 and other concurrent projects have not been modelled/reported. Only a cursory description of cumulative impacts is provided. ( Ed: The M4 East construction period coincides would coincide with the New M5 project if approved)
d) Section 8 Future conditions without the project
- Has the impact that the forecast decreases in LoS will have on travel demand been fed back into the demand model? The decreases in LoS will reduce travel demand by influencing a number of long and short term travel choices:
- Home location choice;
- Work location choice;
- Destination choice;
- Mode choice;
- Departure time choice; and
- Route choice.
As such, it is unlikely that the future ‘do minimum’ scenarios will be as bad as claimed. We know that congestion is self-limiting – as LoS declines, travellers will adjust their travel behaviour/choices to avoid congestion.
- Tables 69, 70, 74, 75, 77 and 78 do not include the base year (2012) values, so the future ‘do minimum’ scenarios cannot be compared with current conditions.
- Tables 72, 73 and 76 use 2014 as the base year, instead of 2012 as used elsewhere in the EIS. To understand the impacts of the project, a consistent baseline must to be used.
- An assessment of the impacts on walking and bicycle demand and travel times has not been provided.
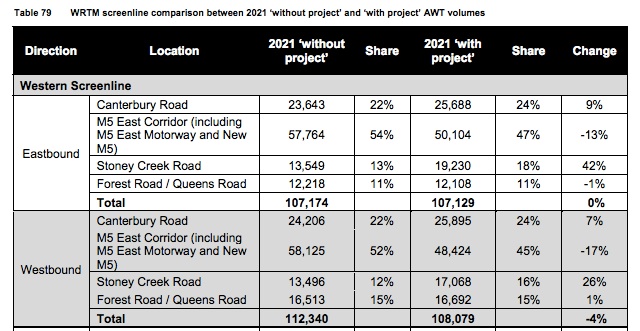
e) Section 9 Future year traffic volumes and patterns
- Tables 79, 80, 81 do not include the base year (2012) values, so the future ‘with project’ scenarios cannot be compared with current conditions.
- Figures 67, 68, 69, 70, 71, 72 do not include the base year (2012) values, so the future ‘with project’ scenarios cannot be compared with current conditions.
f) Section 10 Future conditions with the project
- Delays at on-ramps and off-ramps have been omitted from the travel time forecasts, so actual travel times will be significantly higher than those forecast.
- The reported travel times savings have been selectively chosen to show only those routes where travel times are forecast to decline (i.e., the M5 itself). The impacts on travel times for adjacent routes have not reported, in particular Stony Creek Road, Canterbury Road Forest Road and Queens Road. Travel times on these routes will increase significantly due to the large increase in traffic diverting to avoid the M5 tolls.
- Network performance measures (VKT, total travel time, average speed etc.) for the whole study area (nor for the whole metropolitan area) have not been modelled/reported. Only performance measures for the immediate area around the St. Peters Interchange have been reported. Without this information, the
- An assessment of the impacts on walking and bicycle demand and travel times has not been provided.
References
- Newman P, Kenworthy J. Costs of automobile dependence: global survey of cities. Transp. Res. Rec. J. Transp. Res. Board 1999;1670(1):17-26. doi:10.3141/1670-04.
A more recent piece by Professor Newman

[…] and noise impacts are completely dependent on the traffic modelling. We have already seen from Chris Standen’s submission that the traffic impacts of the New M5 are extremely uncertain. For this reason, the air, noise, […]
LikeLike